What Happens Inside JVM Memory? Scope & Example Walkthrough
A step-by-step walkthrough of JVM runtime memory areas — how stack frames are created, where variables live, and how the JVM tracks execution flow.
When a Java program runs, it isn’t just executing lines of code — it’s interacting with a complex memory model managed by the Java Virtual Machine (JVM).
Many developers are familiar with terms like “heap” and “stack,” but how does the memory behave at runtime?
What happens when a method is called? Where are variables stored? How does the JVM track execution flow?
An understanding of JVM internals can help developers:
- Avoid memory leaks by knowing how objects are allocated and garbage collected
- Optimize performance by reducing unnecessary memory usage and stack overhead
- Debug efficiently by understanding stack traces, method calls, and memory allocation
- Improve concurrency handling by managing thread stacks effectively
Let’s begin by revising the key memory areas of JVM:
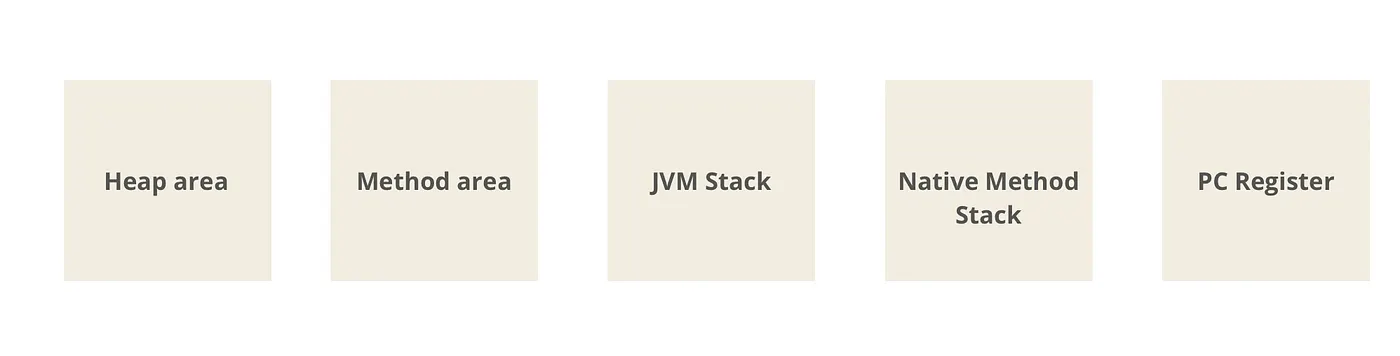 JVM Memory Area Structure
And the flow of runtime memory areas creation on JVM startup for a program:
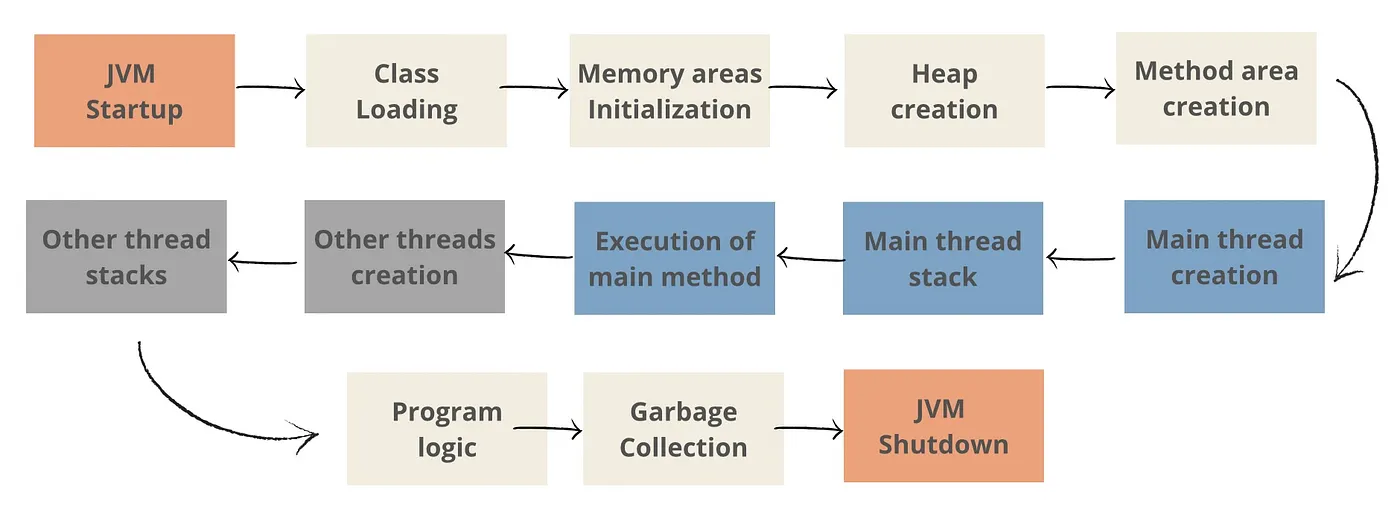 JVM startup and memory areas being created along with main thread execution.
Here’s a simplified table that focuses on what each JVM memory area stores, what is the scope of each area, when is it created and destroyed:
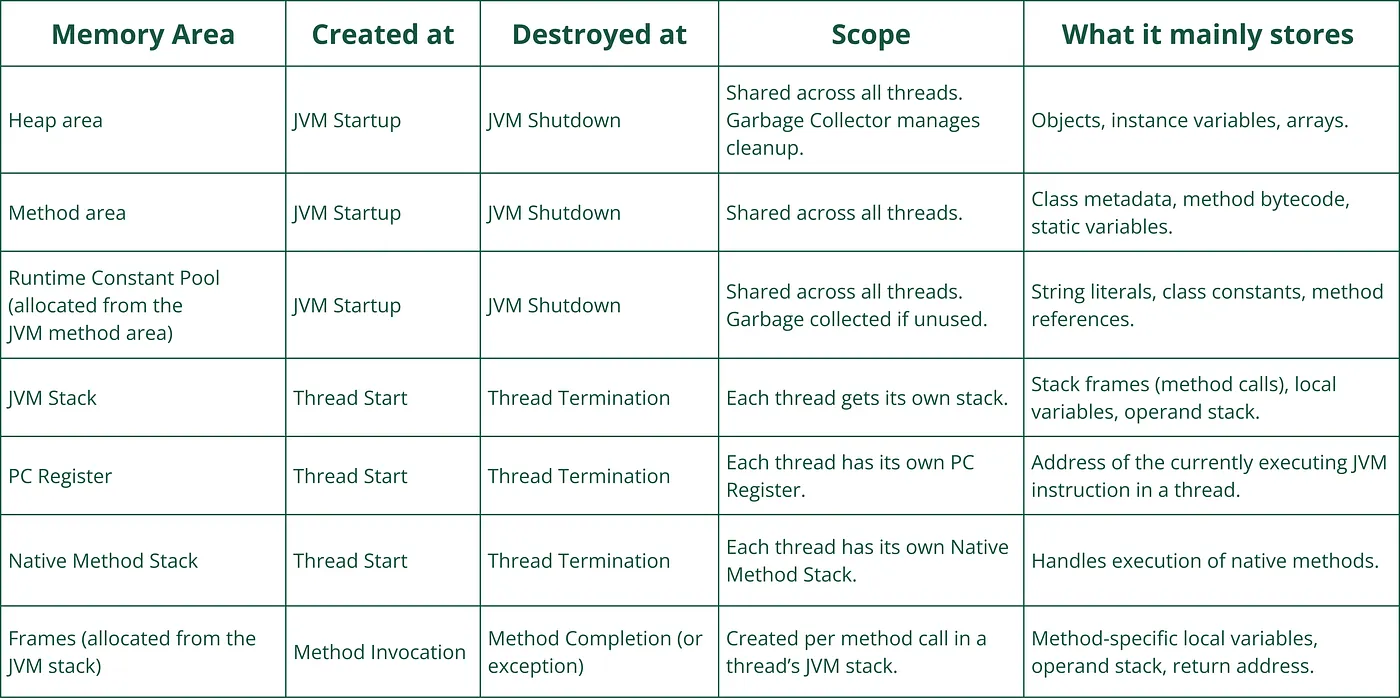 JVM Memory areas with their creation/destruction scopes and storage information.
With this understanding, we’ll analyze a simple Java program step by step to see how memory is allocated, how stack frames are created and destroyed, and how the JVM tracks execution flow.
Consider the below program:
public class JvmMemoryDemo {

    // Static variable (Stored in Method Area)
    private static String staticString = "Stored in Method Area";

    // Instance variable (Stored in Heap)
    private String instanceVariable;

    // Constructor (Heap Memory Allocation)
    public JvmMemoryDemo(String value) {
        this.instanceVariable = value;
    }

    // Method (Creates Stack Frames)
    public void demonstrateStackFrames(int number) {
        int localVar = number * 10; // Local variable (Stored in Stack)
        recursiveMethod(3);  // Calls another method (Creates new stack frames)
    }

    // Recursive method to show stack frames in debugger
    private void recursiveMethod(int count) {
        if (count == 0) return;
        recursiveMethod(count - 1); // Generates multiple stack frames
    }

    // Main method (Entry point - Creates Main Thread & First Stack Frame)
    public static void main(String[] args) {
        // PC Register points here initially

        // Step 1: Heap Allocation
        JvmMemoryDemo obj = new JvmMemoryDemo("Heap Object 1");

        // Step 2: Method Area Reference (String Pool)
        String constantString = "Constant Pool String";

        // Step 3: Stack Frames
        obj.demonstrateStackFrames(5);

    }
}
When we run the above code, these are the steps that happen within JVM:
Step 1: JVM Starts & Loads the Class
When we run JvmMemoryDemo.main(), the JVM first loads the class into memory.
The Method Area stores:
- Class Metadata (
JvmMemoryDemo.class) - Static Variables (
staticString) - Runtime Constant Pool (
"Constant Pool String"stored here)
PC Register points to the first instruction of main().
JVM Stack is empty at this point (no method calls yet).
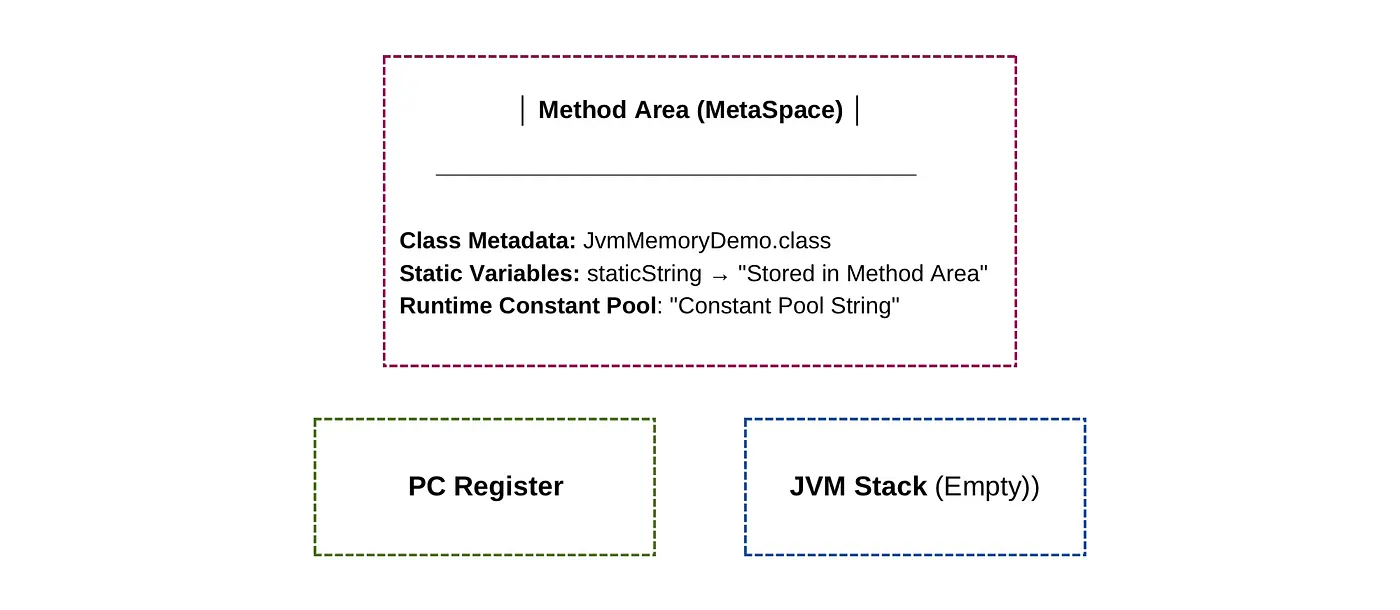 Memory Layout after JVM Startup
Step 2: Enter main() Method
A new Stack Frame is created for main() in the JVM Stack.
main() starts executing:
Object(obj)is created in the Heap MemoryconstantStringreferences String Constant Pool inside Method Area
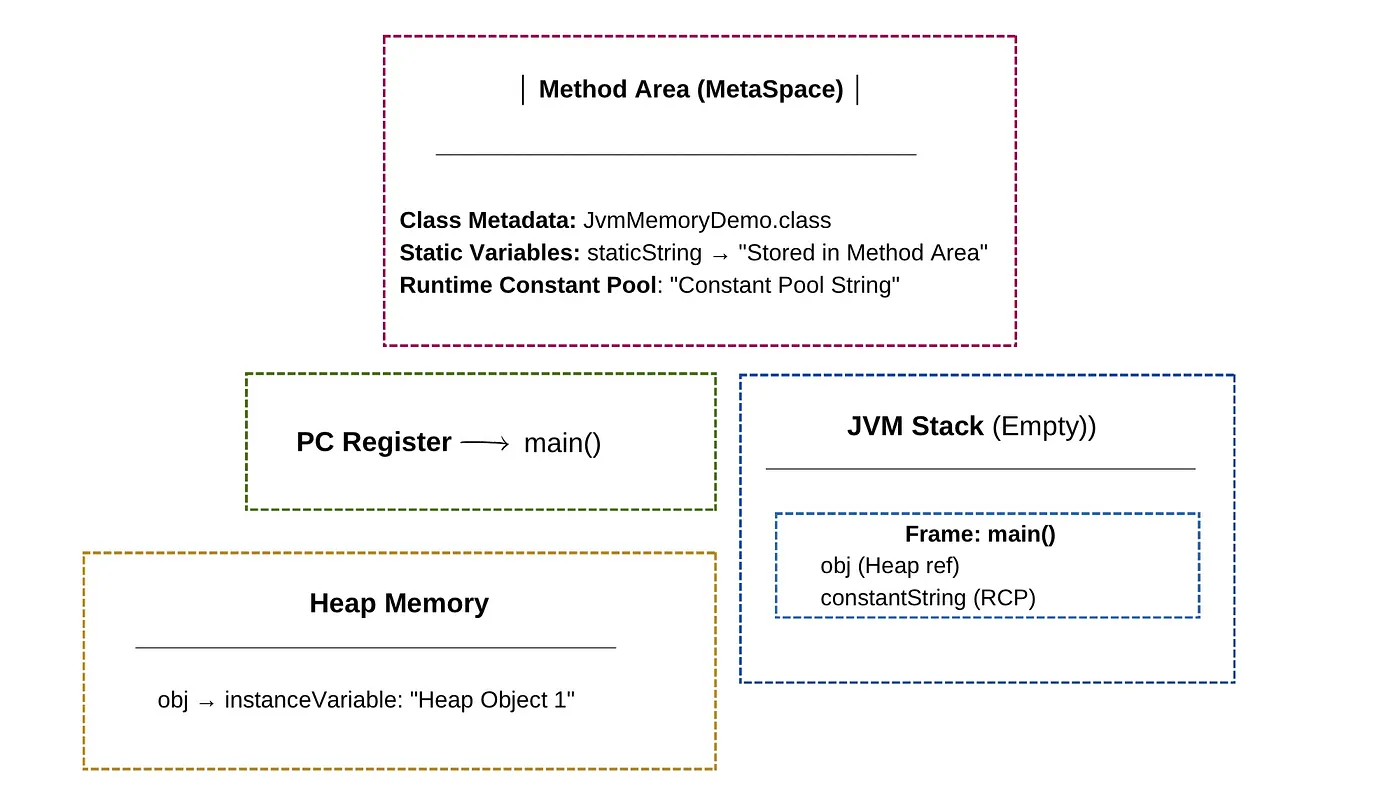 Memory Layout after Object Creation
Step 3: Call demonstrateStackFrames(5)
A new Stack Frame is created for demonstrateStackFrames().
Local variable localVar = 50 is stored in JVM Stack.
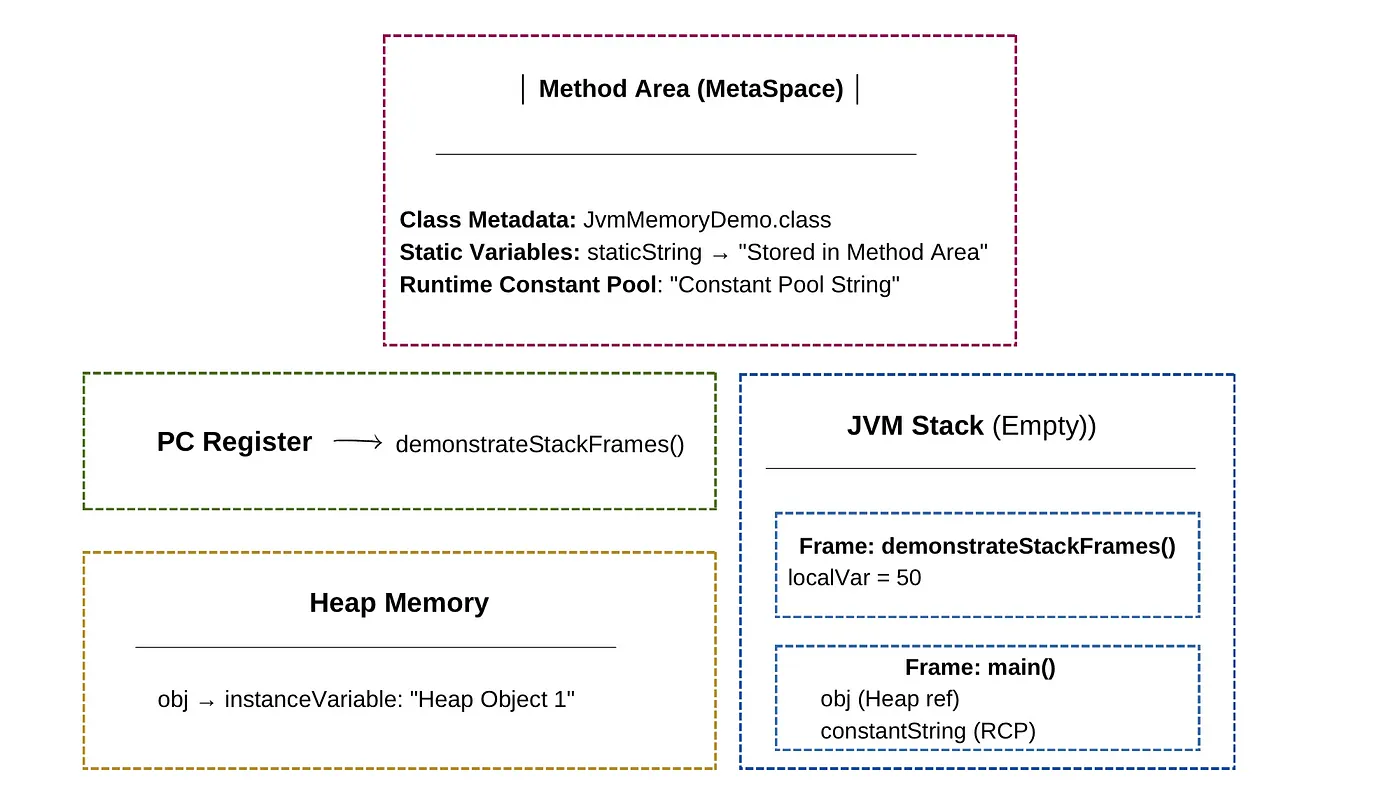 Memory Layout after Stack Frame Creation
Step 4: Recursive Calls in recursiveMethod(3)
Every recursive call creates a new Stack Frame, leading to stack growth.
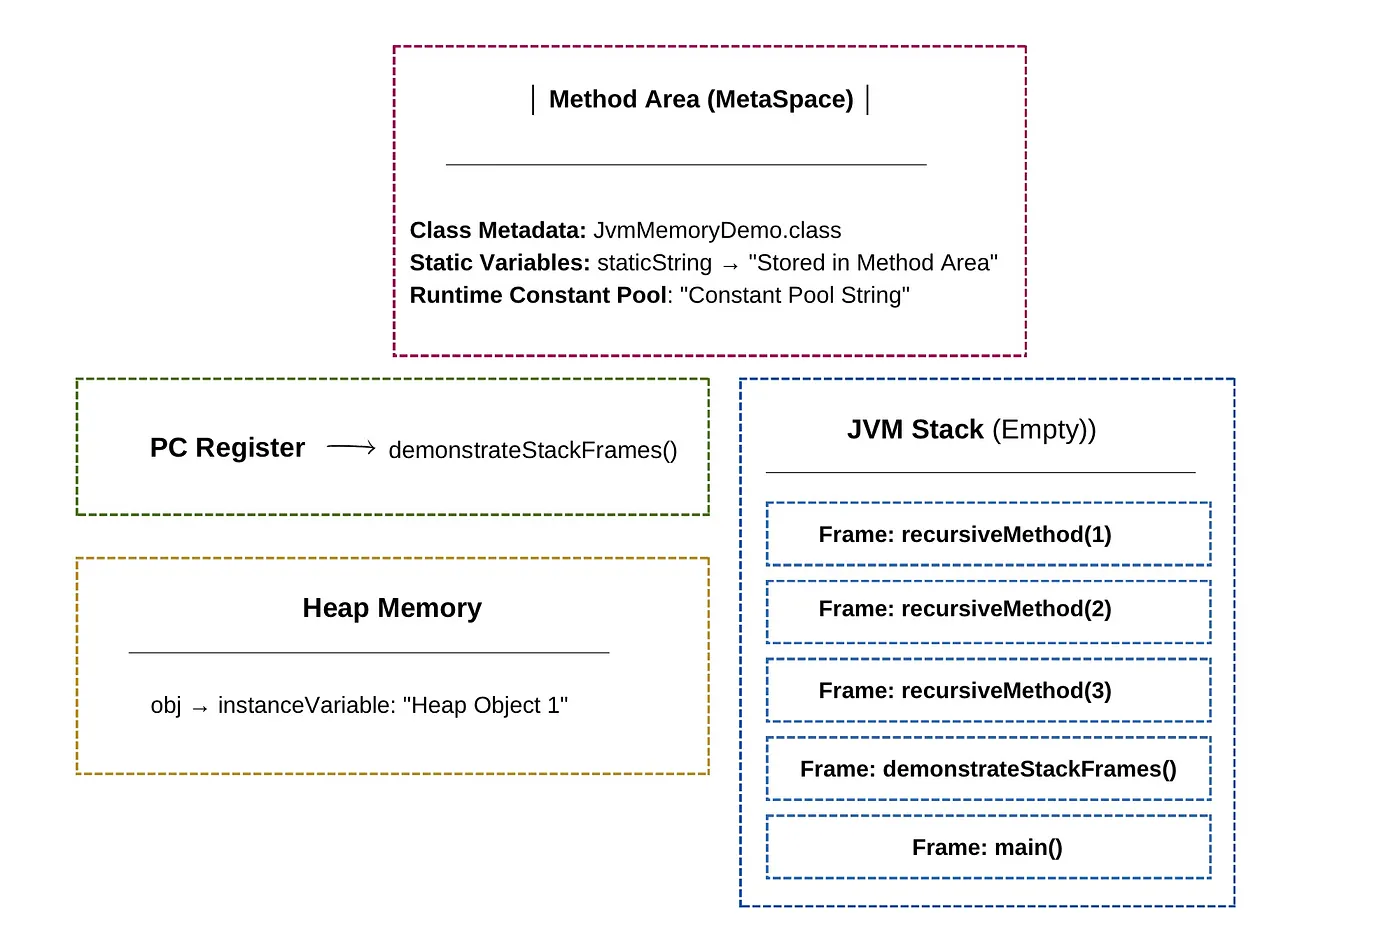 Memory Layout with Recursive Calls
Finally, after all the frames are collapsed, this is what the Final Memory Layout looks like:
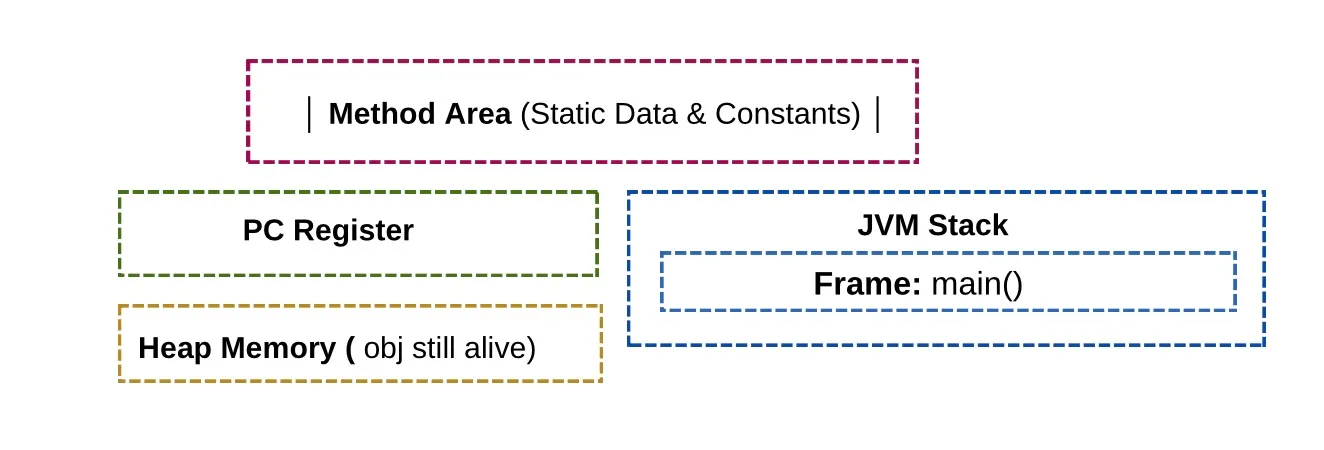 Final Memory Layout
Summary
In this article, we explored the JVM runtime memory areas in detail, breaking down their roles, creation and destruction times, and scope. Using a simple Java program, we visualized how method calls create stack frames, how constants are stored in the Runtime Constant Pool, and how memory is managed across different areas.